Math Data and Computing
As designers we try to find ways to support our decisions when developing a product. With making models and analyzing data collected, designers are able to develop effective and useful tools to communicate their choices. Often reality is quite hectic, so finding patterns within the many interwoven factors that may affect one's design can prove to be an invaluable skill.
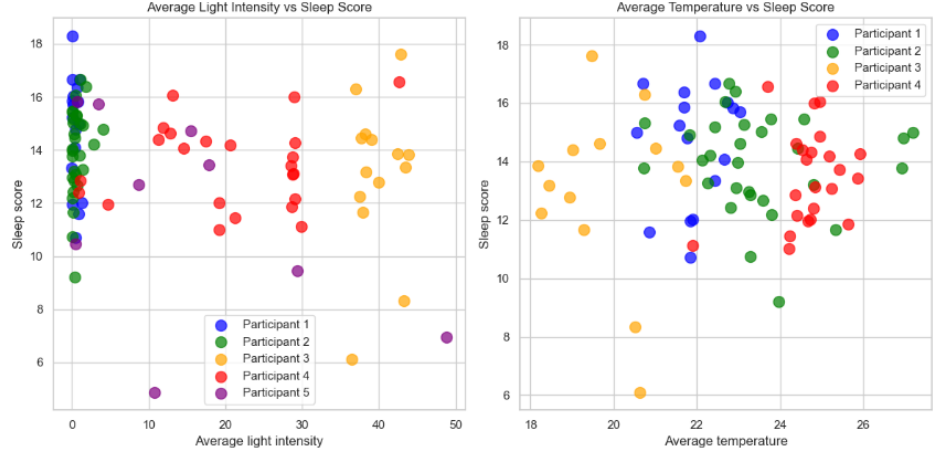
Scatterplot visualizations of all participants sleep scores (a) average light intensity vs sleep score (b) average temperature vs sleep score.
Making Sense of Sensors
In order to design solutions, problems need to be understood and communicated using academic language, especially when needing to justify the context of interest. While only a preliminary study, an experiment was conducted on the correlation between temperature, light intensity, and their impact on sleep quality among students. In order to measure this, two devices were used to evaluate the state of the sleeping environment (light and temp) and the quality of the sleep of an individual. The results, while potentially demonstrating some correlation, ultimately can not be fully supported due to the lack of participants. Though this does not negate the fact that it shows my capabilities with setting up academic quality experiments, and translating the results into clear and tangible information to support possible future designs.
Multidisciplinary CBL
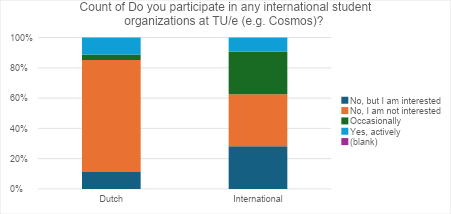
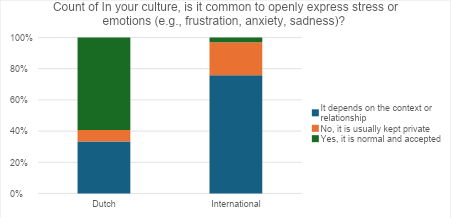
This expertise area is also about one's ability to handle data and determine trends within the results, in order to provide support and context for critical design designs. When given the task to ‘create a healthy workspace’, it was essential to understand any individual present within the workspace, as their satisfaction is ultimately the success criteria. By conducting a survey with mostly second year students that focused on the different experiences between natives and internationals on the TU/e campus, a data supported understanding could be formed about the current state of cultural stress in this environment. The findings, summarized in a collection of graphs, showed a significant difference in three categories, academic expectation, emotional expression, and social interaction. This project shows my ability to be able to identify, seek out, and analyze data from relevant sources in accordance with the project at hand.
Two exemplar graph results from the survey that was conducted
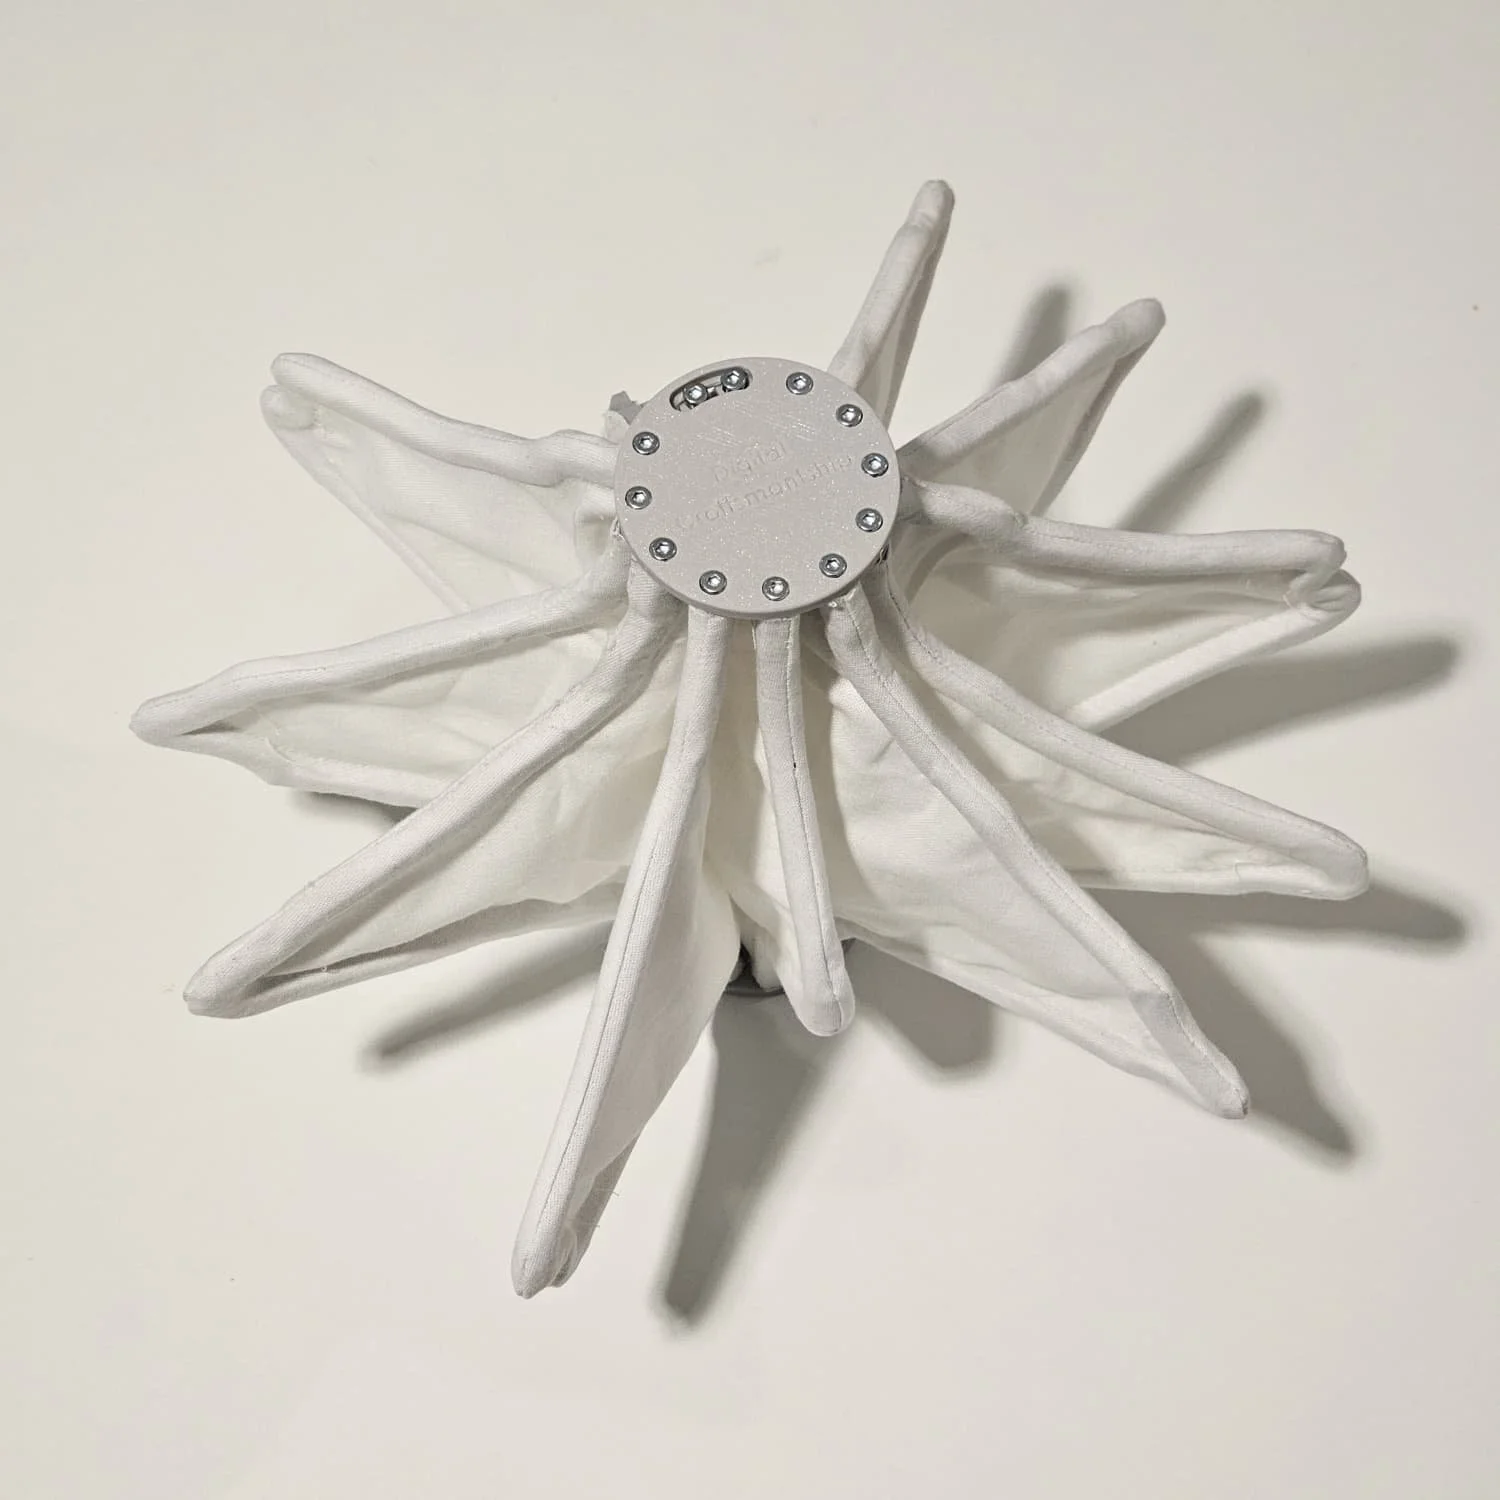
The Gambit stills, portraying the exterior curves developed through the use of data.
Data as a Material
As more and more focus is put onto the digital sphere, data becomes more valuable. While it is often seen as a tool to support claims or decisions, it can also be used as a material to elevate designs. For this project in particular, we wanted to create a bag which conveys the message of beauty. This stemmed from a general interest in the juxtaposition it created, facing what most would argue a subjective measure of attractiveness, described through the language of objective absolute numbers. This gave form to the Gambit, a bag that attempts to represent the beauty of paradoxes. This project shows my ability to truly lean into the value of data, and allow it to become a leading force in its own sense.